How to Communicate Your IT Budget, Part III
Step Three – The Unveiling
With the work you accomplished in step one and two, it is time to begin focusing on communication. Specifically, how the budget is built, the primary drivers, and validation.Focus on the Core Elements
I like to begin by going back to the key elements picture from Step 1:
Take time to walk through each circle on the diagram above. Doing so allows you to establish a standard vocabulary with your audience while illustrating your primary budget drivers.
Be sensitive to local conventions and vernacular; consider adjusting your own when necessary. Avoid unproductive discussion about terminology whenever possible, the goal is to arrive at a common and informed view.
As a side note, one of the benefits of previewing the budget, as discussed in the Validation section of Step Two, is to identify and resolve many, if not all, these issues early in the process.
Assembling the Pieces
With the essential core elements driving the IT budget defined, it is time to show the relative size of each component. Using a stacked column graph is one effective method of communicating this point.Consider the following graph:
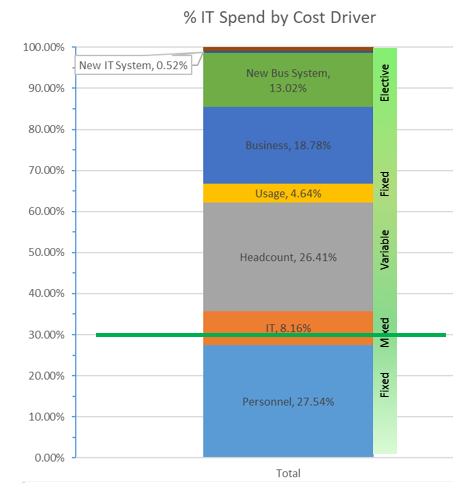
For a simple picture, there is a lot of information here. Let’s examine some of the key points:
- The overall budget buildup is shown in a layered approach (more on the ordering later).
- The relative size of each budget component is displayed.
Important point: The use of relative percentages is intentional. Too often you can get sidetracked by sticker shock. As we are still working to communicate the budget's construction and primary drivers, avoiding specific dollar figures helps keep the discussion focused.
- The horizontal green line is used to indicate the division of costs directly driven by IT (below the line) and those driven by the business (above the line). The above the line costs include usage costs, headcount costs non-IT), business systems, etc.
Consider finance your critical partner as you develop the budget. It is imperative they understand and support your categorization process.
- Another important feature is the vertical green bar on the graph’s right side. This line shows the degree to which IT directly controls the number. For this graph, I typically suggest the following breakdown:
- Fixed: Two sub-components.
- Personnel is the first and often the most significant element. Included in that category are the core IT staff and external partners required to support the business. Activities include everything from operations, application support user support, compliance, IT analysts working with other departments and functions.
- Depending on your expenditure levels, you might want to further segregated personnel costs associated with business systems. Those costs could then be layered to show both the technical and personnel costs.
- Core Infrastructure: Cost to support essential IT infrastructure supporting the business. Examples include network backbone – routers, switches, firewalls, local computing resources, telephone, and other systems under IT’s umbrella.
- Mixed: This category can be difficult to align on, especially within IT. It is intended to show the portion of IT spend that is discretionary. This could include line items such as training, existing or new development environments, IT testing of new technology and the like.
- Variable: These costs are driven by usage and headcount and vary accordingly. Estimates are a function of the quality of headcount projections (over time) and usage which includes utilities, communications, and even SaaS solutions.
- Committed: Ongoing costs for currently deployed systems. Key drivers include licensing and support. Many contracts for services/licenses have fixed terms, so these costs are in effect committed for some period. Systems and solutions that are ad hoc in nature go under the Variable category.
- Elective: Cost of implementation of new capabilities/systems for both IT and the business.
The Value of Percentages
The budget elements outlined above are valuable and together help you put budget discussions in context. Recall my opening comment about the relative size of the IT budgets. With great size can come great cuts.So, consider this example. IT has a budget of $50MM. You are asked to reduce the budget by 10%, giving back $5MM. The problem with this question is assumes you control the whole IT budget - its size and where how the money is spent.
As we have shown above, that is far from the case. The part IT “controls” is likely substantially less than $50MM. Consider the case where 60% of the cost is driven by the business. In that scenario, the net effect is the $50MM budget is only $20MM directly controlled by IT. Therefore, a reduction of 10%, should only be considered on the $20MM for a net amount of $2MM, not $5MM.
The more significant "ask" does not just vanish; addressing it requires the involvement of many departments.

